New Defender Vengeance Question.
By
Anti_Proton,
Posted on: 2010-10-19 05:45 in CoH and CoV General Discussions
While this topic is severely off topic, I will say that Scourge greatly boosts the corruptor's overall damage. Remember, a Defender who is damage capped, is damage capped. A corruptor who is damage cpaped, can still proc scourge. Corruptors vastly out damage defenders in long fights, specifically against +3/+4 mobs and against AVs. Other than these two situations, the damage difference is still moderate but not massive.
But a Corruptor will -always- out damage a defender. Solo, Scourge plays a much better roll. On a team, the defender loses the 30% damage boost, thus corruptors pull ahead. People tend to forget that.
Whining about everything since 2006.
Ammo switching for Dual Pistols was my idea:
http://boards.cityofheroes.com/showthread.php?t=135484
The question then becomes whether, on teams, the increased buff/debuff modifiers of a Defender make up for their lower damage relative to a Corruptor (basically, whether their buffs and debuffs allow the rest of the team to perform better than if a Corruptor occupied that spot). My gut instinct on that is "no," as while buffs and debuffs make killing things easier, they do not kill things in and of themselves. Obviously I don't have the math to show for this because I hate mafs (though I somehow managed to follow the calculus bit upthread).
@macskull, @Not Mac | XBL: macskull | Steam: macskull | Skype: macskull
"One day we all may see each other elsewhere. In Tyria, in Azeroth. We may pass each other and never know it. And that's sad. But if nothing else, we'll still have Rhode Island."
"One day we all may see each other elsewhere. In Tyria, in Azeroth. We may pass each other and never know it. And that's sad. But if nothing else, we'll still have Rhode Island."
Quote:
That, yes |
Originally Posted by GuyPerfect

I believe you mean this:
 |

Quote:
| Scale is irrelevant, as we're only looking for the fraction of the whole that the blue region covers. There are 40 squares in the image, and the blue region clearly covers 12 squares' worth of area. 12 / 40 = 30%. |
Quote:
|
Originally Posted by Arcanaville
Samuel_Tow is the only poster that makes me want to punch him in the head more often when I'm agreeing with him than when I'm disagreeing with him.
|
Quote:
Well, that's why it's a graph and not an optical illusion. The calculation's easy enough to do in my head for what it's worth, even without a chart to look at. (-:
|
Originally Posted by Samuel_Tow
True, but are you sure your line passes through the corners of the squares exactly? I mean, once you calculate it, yes, you can be sure (it's provable) but you can't really just go by eye.
|
Quote:
FWIW, I can look at that "missing square" graph and tell, by eye, that the slope has changed.
|
Originally Posted by Samuel_Tow
True, but are you sure your line passes through the corners of the squares exactly? I mean, once you calculate it, yes, you can be sure (it's provable) but you can't really just go by eye.
|
Yeah, the farther back you sit, the easier the edge is to notice. But even if you don't have good eyes, it's pretty plain to see that the red triangle has a slope of 3/8 and the teal triangle has a slope of 2/5. Put them together and they'll never made a continuous edge.
I believe you mean this:

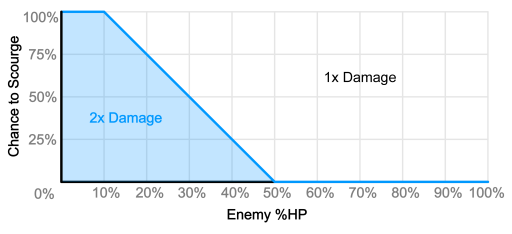
My Scourge graph isn't like that, as the slope is actually defined as a line:
Scale is irrelevant, as we're only looking for the fraction of the whole that the blue region covers. There are 40 squares in the image, and the blue region clearly covers 12 squares' worth of area. 12 / 40 = 30%.